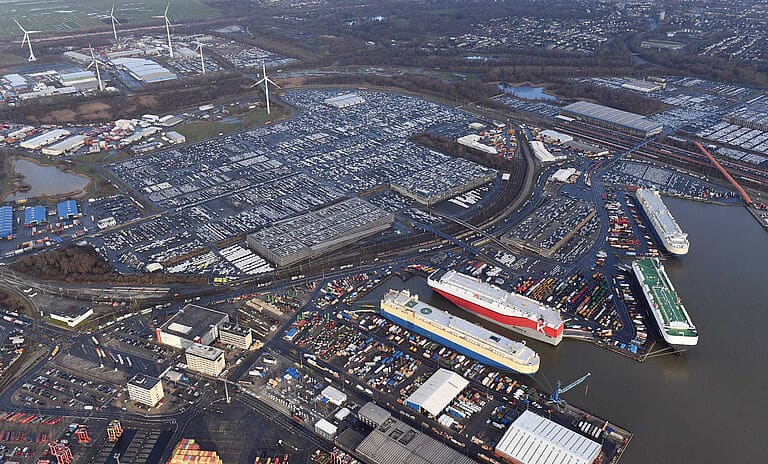
A major focus area here at Esgian Shipping is analyzing and measuring vessel behavior and activity. Without activity, there will be no goods transported (nor will there be any emissions). In short, a shipping line's main purpose is to transport cargo from A to B in the most efficient manner.
Looking at vessel activity, this can be categorized into three main areas:
- Sailing or in transit, i.e. en route between ports with (preferably) cargo
- Port time, i.e. physically at a terminal loading or discharging a.m. cargo
- Idle or standby, i.e. unproductive time as the vessel is not doing any value-added work ref point 1 and 2. This is thus impacting overall fleet utilization and availability to tonnage and as such freight rates
In this week’s release of the Esgian Shipping Suite for RoRo, we enabled our users to see the activity across the deep-sea and short-sea fleet that we cover over the past three years*, so let’s take a little deep dive in the deep sea fleet’s activity since 2021.
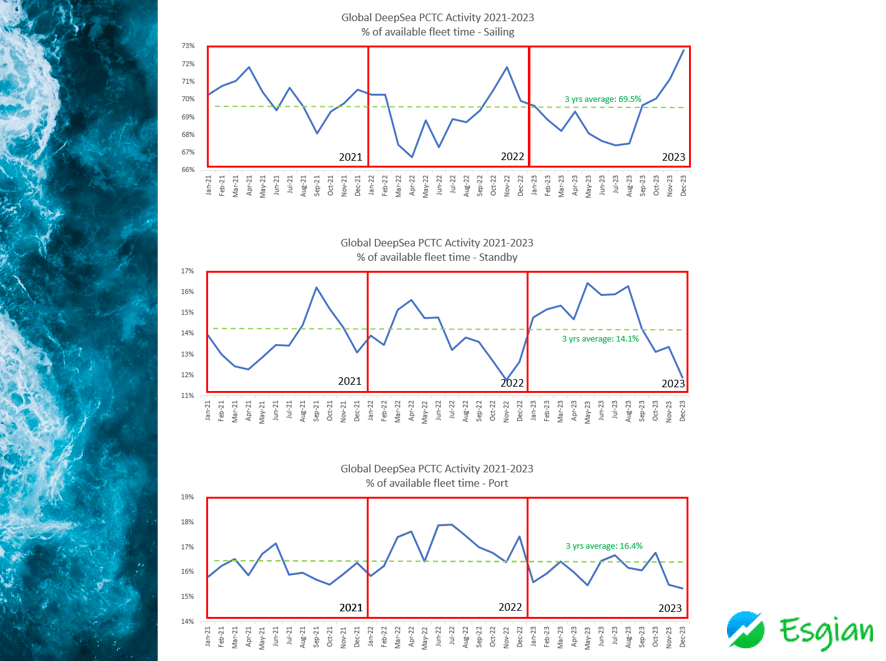
Sailing Time (top graph)
We see that the three-year average percent of time sailing was just under 70%. In 2021 it was slightly over whereas it has been slightly under in the last two years. It’s interesting to note the sharp increase from 67.4% in July this year to currently 72.8% in December (1-15th). This is also the highest relative share of trading days spent sailing in the past three years., i.e. more transport work being carried out.
Standby or Idle (middle graph)
As commented on above, the higher percentage of the fleet being in this activity mode, the less capacity is available in the market. It is really “sunk cost” as the vessel will not earn (generally) any freight revenue and the main factors affecting this value are port and canal waiting time – often so called “congestion”.
The three year average stands at just over 14% with 2021 seeing 13.7% moving up to 13.8% last year to… a rather substantial 14.8% in 2023. You might say – one percent that isn’t much? Well, if you take 670 deep sea vessels having 360 days theoretical trading days (5 days for docking and repairs on average taken out), you have actually close to 1/4 million trading days per year or over 20.000 trading days per month available. That 1% up or down now actually translates into 201 trading days per month. Simply put, inefficiencies so far in 2023 means the equivalent of close to 7 deep sea vessels being taken out of commission. If we assume an average voyage of 60 days, meaning 6 voyages per year per vessel with a capacity of say 6.000 cars you get a “loss of transportation” of 7 ships x 6 voyages x 6.000 cars = 250.000 + cars. Ops, suddenly one percent became a big number.
For the avid reader, you probably see the massive decline from May 2023 (16.4%) to this month trailing at 11.9% being both the sharpest decline and the lowest relative number in the past three years. Silver lining on the horizon?
Port (bottom graph)
Looking at the actual time spent in port, we quickly see that 2021 (16.1%) and 2023 (16%) both trend below the three year average of 16.4%. On the other hand, 2022 reports highest the highest average with 17% peaking in the summer of, no, not ’69, but ’22 with close to 18%. Don’t need to remind you of just how much 1% means right?
There are many factors that influence actual time spent in port, but the two main ones include a) cargo volume and b) general port efficiency which is mostly labor related (stevedoring). Just like for standby, it’s promising to see this also improving – especially from last year.
Closing Remarks
Albeit we leave to our clients to draw their own conclusions basis our independent high quality data, one can argue that we are heading for a somewhat more balanced market. With supply chain disruptions – while still present – indeed easing, we see this translating into less capacity tied up in ports – or outside them. That being said, Australia, Panama, Mexico and certain other areas around the globe still pose bumps in the road – and lately now geopolitical tension is creating new challenges for safe Suez canal transit and operations in the Red Sea.
One thing is sure – shipping is a dynamic industry and historically cyclical – armed with the Esgian Shipping Suite for RoRo, we enable our clients to understand the developments and see the impact of same. In the end of the day, shipping is a supply and demand equation put into real life.
*01.01.21 – 15.12.23