Analyze global activity in the global RoRo and MPP fleet through activity map and intuitive analysis tools. Compare operators performance in a range of parameters vs segment average and turn data into actionable insight.
Shipping Analytics
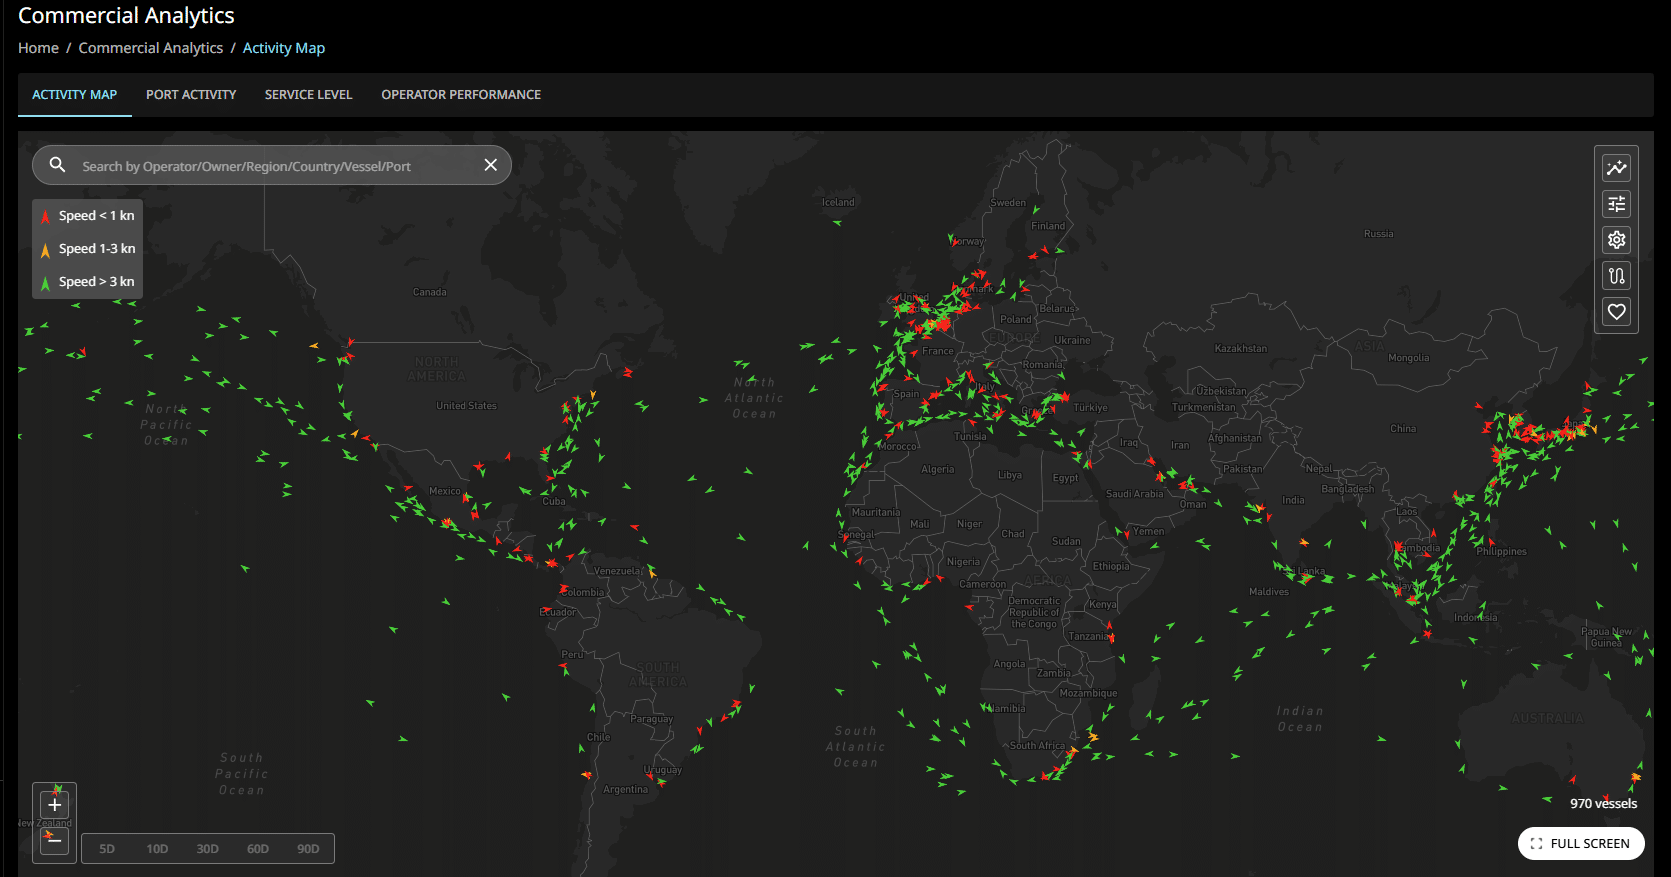
Track activity level
Generate customer market analysis and graphs
With our analysis functions you can slice and dice the global RoRo and MPP fleet to compare and analyze trends, study the global trading balance and explore geographic footprint. Our range of graphs provides customizable visualizations to make the data easier to understand. Shipping Analytics digital platform makes tracking and analyzing the shipping market a breeze. Our dynamic data, graphical visualizations, and modern interface give you the power that static reports and outdated interfaces can’t provide.
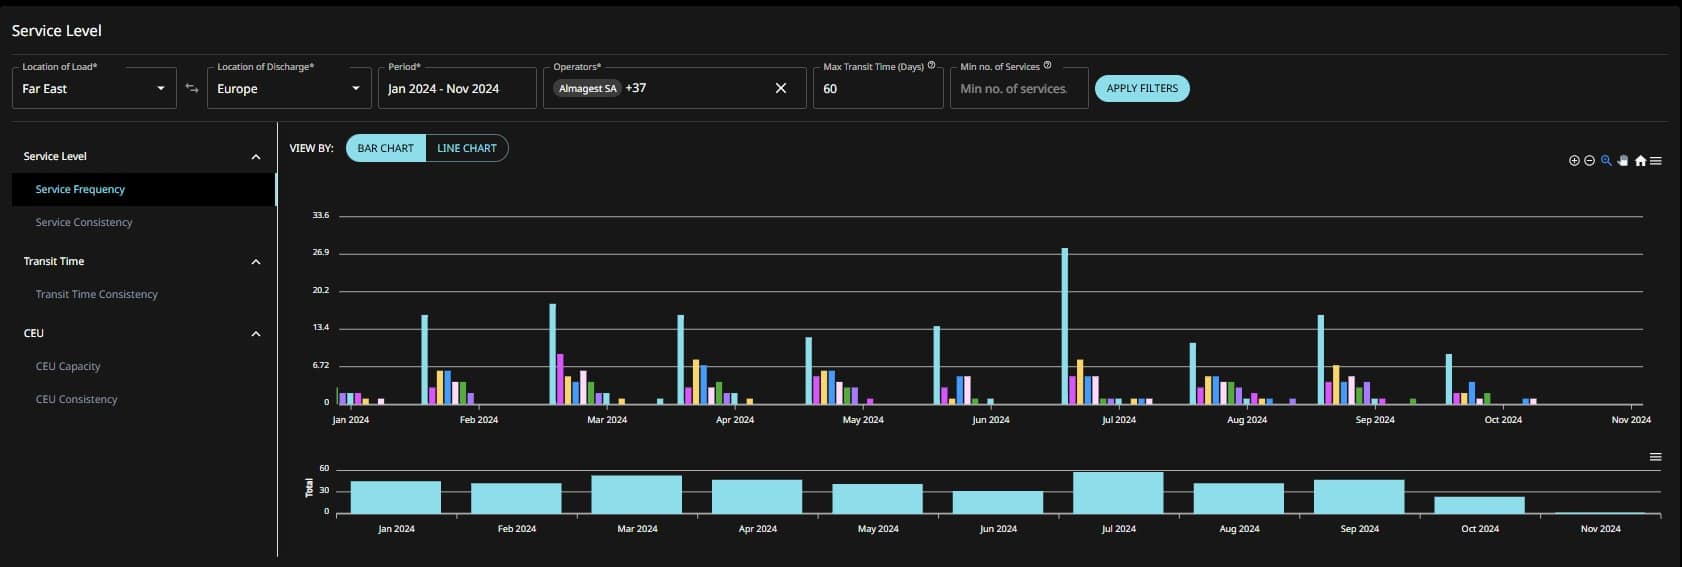

Analyze service level performance
Whether you are a cargo owner or a shipping line, the service level is a major purchasing criterion for ocean transportation. For the cargo owner, are you getting the service you pay for and just how good are my suppliers vs competition? For the shipping line, how competitive is my product offering?

Market and competitiveness insight
Stay informed and gain unparalleled insight into the global RoRo and MPP market dynamics. Discover trading patterns and schedules, port activity and port-pair service performance.

Unbiased, real-time data
The RoRo and MPP segments we cover are globally tracked 24/7, 365 days a year, providing unbiased, real-time data, and up-to-date analysis.

Continuous improvement
Our software grows together with the market and our clients. We monitor the market needs and have a focus on continuous deployment of new and valuable industry applications.
Our software grows together with the market and our clients. We monitor the market needs and have a focus on continuous deployment of new and valuable industry applications.
Disclaimer, Terms and Conditions
The data and estimates provided on this Platform reflect Esgian’s assessment at the time that they are made available as part of the Service. No guarantee can be given that such data and estimates are accurate. The content is provided for its intended recipients only and shall not be published or circulated to a third party without our prior written permission. Whilst Esgian AS has endeavoured to provide accurate and reliable data, no liability with respect to its completeness or accuracy is accepted. Any reliance on the data and estimates is done on your sole risk.
Upon accessing the Service you accept our Terms and Conditions which we encourage you to read carefully. These can be changed at any time, and the latest version can be found here.
Who needs Shipping Analytics?
The tool provides unique insight into the relative service delivery across all major KPIs with frequency, transit time and reliability across some 460+ global ports & 120 000+ port calls, and counting. This is highly valuable intel for both sides of the supply and demand function. Operators can compare and benchmark their own performance against their peers whereas the cargo owner, whether being a freight forwarder or OEM can assess their suppliers’ performance against the alternatives. Albeit one can segment the main user groups into four: 1) Commercial ship operators, 2) Tonnage providers/ship owners, 3) Freight forwarders and 4) OEMs, the system will provide valuable data for all stakeholders looking to gain a deeper understanding of the dynamics of the shipping industry.
How is the data collected?
Esgian tracks the global RoRo fleet using AIS data – input that is also a prerequisite for our Greenpact Ships emission module. By matching each vessel to a commercial operator and geofencing the global ports, we can track each vessels commercial sailing pattern and provide analysis with a 98% accuracy rate.
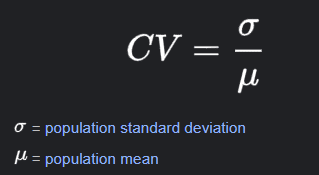
How do you calculate the Consistency Score?
The consistency score is a mathematical formula that looks at the relative standard deviation of a dataset. To make more sense of the output, Esgian shows consistency distributed on a relative scale from 0 to 5 with 5 being the best. A score of 5 means that the service is 100 % consistent in terms of the number of port calls, port pair service or transit time.
How do you keep the vessel owner/operator mapping updated?
Through our strategic partnership with Hesnes Shipping AS, a market leader in the car carrier ship brokerage space, we are able to assign each vessel to a commercial operator on a regular basis.
Will Shipping Analytics allow the user to compare scheduling reliability across the global PCTC fleet?
Yes, it will and that is also one of the core value propositions of the software.