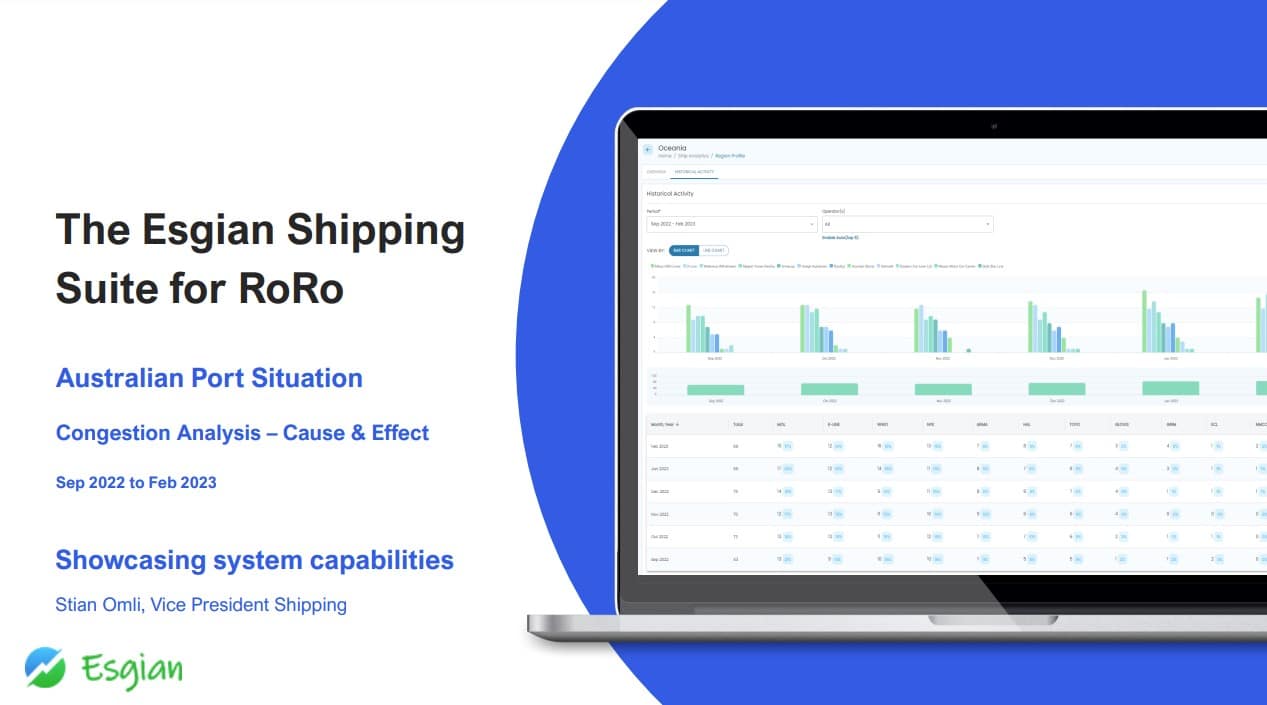
Stian Omli, Esgian Vice President Shipping, is showcasing system capabilities of the Esgian Shipping Suite for RoRo.
A long shower is clogging up the trade flow
- The number of vessels around Oceania has
increased from +/- 60 a day in September to +/-
90 in February – a whopping 50% increase - The number of actual port calls in the same period
has declined indicating that vessels are not getting
a berth in a timely manner - Cargo arriving in Australia is found with biomass
e.g. grass seeds and thus thorough cleaning is
warranted – volume now 5-6 times actual capacity - Albeit a complex picture, this is the main reason
for the current havoc as there is simply not
sufficient physical space to store, clean and clear
the cargo in the port infrastructure
- Total waiting time: 2.819 hours
- Affected calls: 17 port calls with 10 over 100 hours
- Av waiting time: 166 hours
- Longest wait: Morning Cherry (Armacup) in February with 21 days
Waiting time by shipping line:
- WalWil: 1.139 hours / 5 calls
- Armacup: 636 hours / 2 calls
- Hoegh: 451 hours / 1 call ** Hoegh Trooper also engine fire
- Grimaldi: 249 hours / 1 call
- Toyofuji: 160 hours / 3 calls
- NYK: 143 hours / 2 calls
- MOL: 25 hours / 1 call
- NMCC: 11 hours / 1 call
- Total waiting time: 2.843 hours

- Affected calls: 37 port calls with 15 over 100 hours
- Av waiting time: 77 hours
- Longest wait: New Century 2 (Toyofuji) in January with 7 days
Waiting time by shipping line:
- Toyofuji: 573 hours / 5 calls
- K-line: 489 hours / 5 calls
- Armacup: 432 hours / 6 calls
- MOL: 422 hours / 7 calls
- WalWil: 344 hours / 5 calls
- NYK: 257 hours / 3 calls
- Glovis: 182 hours / 3 calls
- Hoegh: 144hours / 3 calls
- Total waiting time: 3.614 hours
- Affected calls: 47 port calls with 12 over 100 hours
- Av waiting time: 77 hours
- Longest wait: Morning Post (WalWil) in February with 9 days
Waiting time by shipping line:
- K-line: 768 hours / 11 calls
- WalWil: 666 hours / 8 calls
- Toyofuji: 567 hours / 5 calls
- MOL: 557 hours / 8 calls
- Armacup: 361 hours / 5 calls
- Hoegh: 208 hours / 4 calls
- NYK: 136 hours / 3 calls
- Glovis: 351 hours / 3 calls
- Total waiting time: 747 hours
- Affected calls: 15 port calls with only 1 over 100 hours
- Av waiting time: 50 hours
- Longest wait: Tonsberg (WalWil) in November with 7 days
Waiting time by shipping line:
- WalWil: 310 hours / 4 calls
- Hoegh: 148 hours / 3 calls
- K-line: 143 hours / 3 calls
- MOL: 68 hours / 2 calls
- NYK: 43 hours / 1 call
- ECL: 35 hours / 2 calls
- MOL has the largest commercial footprint in
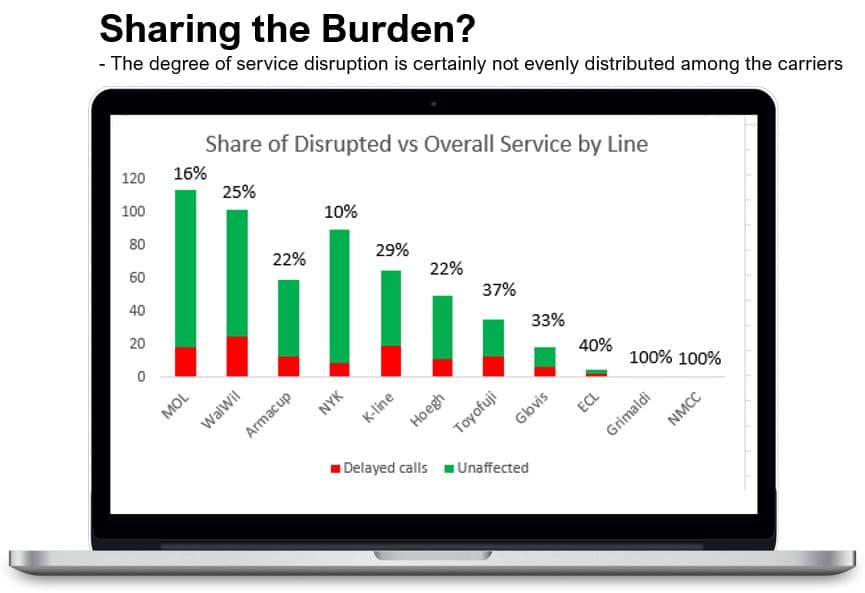
Australia with 114 calls over the four major ports
analysed but only 18 port calls incurred waiting
time, i.e., 18% service disruption - Wallenius Wilhelmsen is close with 102 port calls,
but with 25 affected port calls, the level of
disruption is significantly higher at 25% - NYK takes a clear third with 90 port calls, but
been luckier as only 10% of the port calls incurred
waiting time - Those apart, we see that the degree of disruption
do vary, and some have been more fortunate than
others, but it also depends on the actual
discharge port
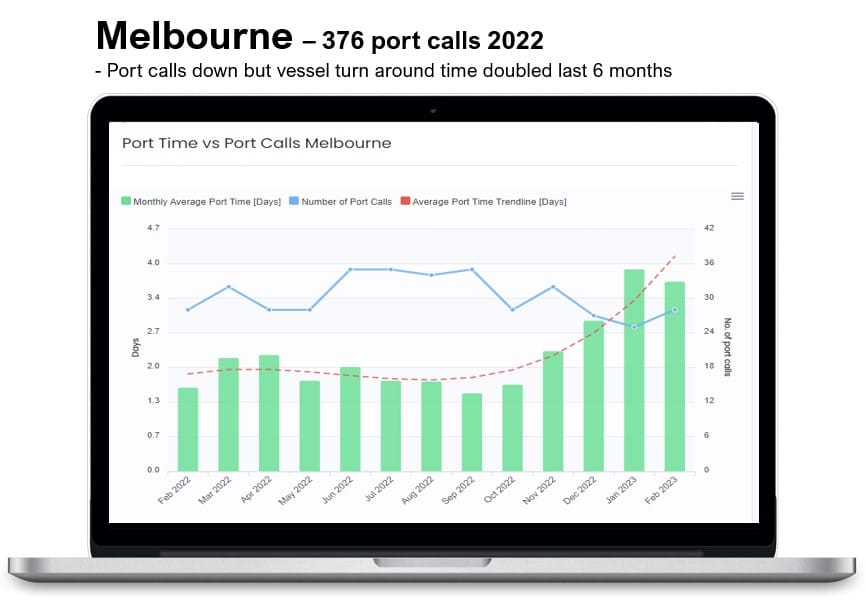
Being the largest discharge port in Australia last year, Melbourne has very unevenly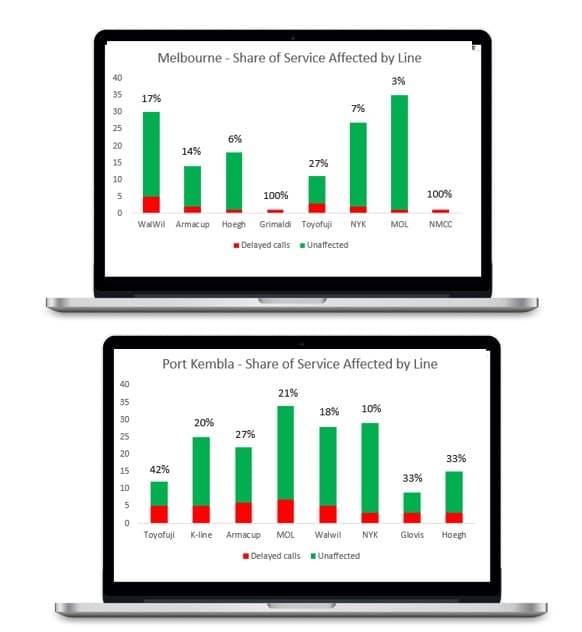
distributed delays
- MOL having 35 calls saw only 1 vessel delayed, i.e. 3% service disruption
- Wallenius Wilhelmsen being 2nd largest carrier with 30 calls had 5 vessels tied up
in congestion affecting 17% of their sailings - NYK has also a high presence in this port with 27 calls of which only 2 got
delayed, i.e. 7% - Other carriers saw delays of 6% (Hoegh), 14% (Armacup), 27% (Toyofuji),
whereas both Grimaldi and NMCC got delayed with both their vessels
For the 2nd largest discharge port, Port Kembla outside Sydney, the share is more
evenly distributed but also affecting the carriers more severely
- MOL being the largest also here with 34 calls, 21% got affected
- NYK is second with 29 calls, but only 10% affected being the lowest of all
- Wallenius Wilhelmsen is ticking in at 3rd with 28 calls, but saw a whopping 29% of
calls being negatively impacted - Following the top three we find Hoegh (20%), MOL (21%), Armacup (27%),
Glovis (33%) and the most unfortunate being Toyofuji with 42% impact.
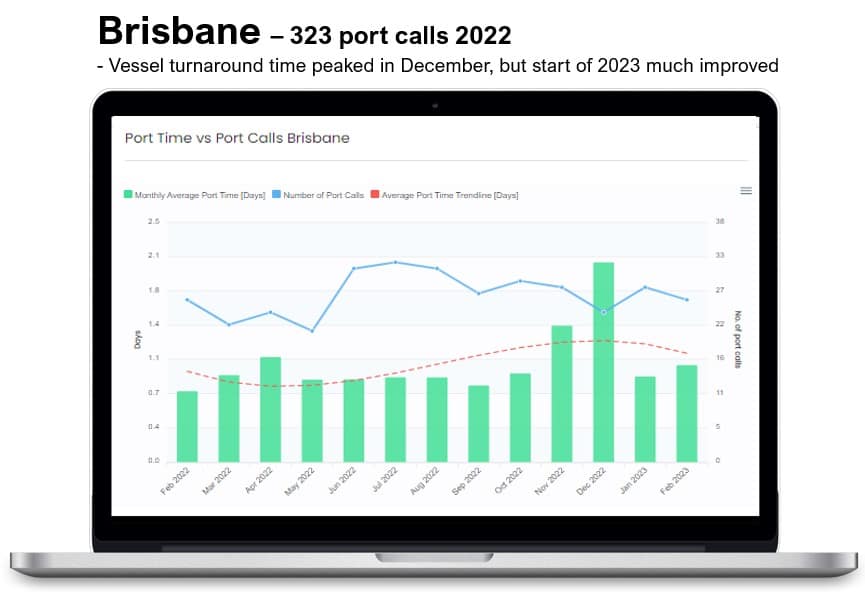
For the 3rd largest port Down Under, Brisbane, we also see a high degree of disruption
among the shipping lines with three carriers seeing over 40% of calls being delayed:
- Wallenius Wilhelmsen has the largest footprint with 28 calls of which 29% being
delayed which is actually 3rd best in this party - MOL and K-line both recorded 27 calls, but with 41% impact on the K-line
service, they were worse hit vs MOL with 30%. - NYK with 24 calls are a significant player, but the one least impacted with only
13% - Armacup saw 22% disruption and Glovis 33%, whereas Hoegh and Toyofuji got
hit 44% and 42% respectively.
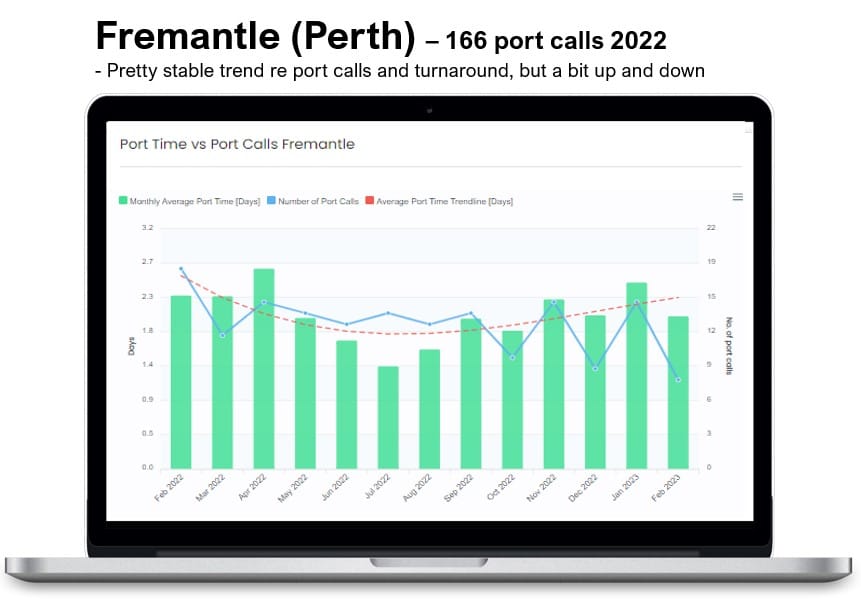
On the West Coast of Australia, Fremantle is a mixed bag indeed:
- MOL is biggest with 18 port calls but only 11% negative impact
- Wallenius Wilhelmsen takes 2nd at 16 calls, but saw a massive 44% of their port
calls delayed, i.e. 4 times that of MOL. - K-line takes 3rd with 13 port calls and with 23% degree of disruption they place
themselves gracefully in the middle - NYK saw 40% of their calls delayed, whereas Hoegh 38% and ECL 40%.
Operator Ranking in terms of service level disruption: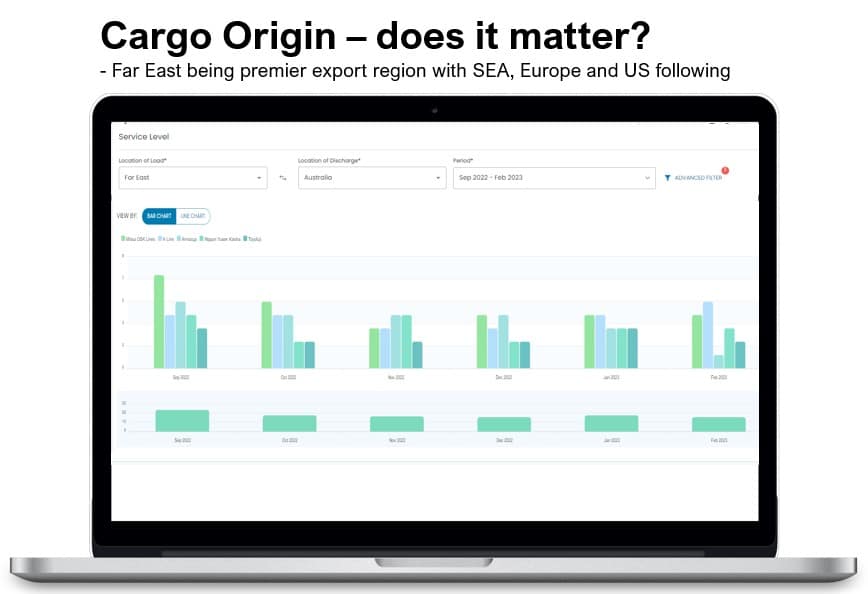
- Toyofuji (37%) with most cargo ex Japan
- Glovis (33%) mostly ex Korea
- K-line (29%) with clear weight on Japanese exports but
also some ex-India and Middle East - Wallenius Wilhelmsen (25%) which is market leader in
terms of frequency ex both USA and Europe - Hoegh and Armacup both saw 22% disruption, but
Hoegh’s strength is ex Europe whereas Armacup is the
largest carrier ex China - MOL with 16% being the largest carrier in Australia also
has a diverse sourcing outreach ex Korea, Japan,
Thailand, USA, Europe and Middle East - NYK saw only 10% of its services held up has the largest
service ex Thailand but also strong ex Far East and partly
Middle East
To sum it all up…
- Australian ports are seeing unprecedented service disruptions and delays as the landside infrastructure is not equipped to handle the sheer
volume of inbound cargo requiring cleaning creating unfortunate domino effects - Unlike BMSB (stink bug), the congestion affects all shipping lines at varying degree as there simply is no space to discharge cargo – regardless of
origin and type - We see that the degree of service disruption do vary from shipping line to shipping line, but nobody is spared
- The degree of congestion also vary from port to port – same goes for vessel turnaround time which is also negatively affected
- Until the situation is resolved or at least comes under control, shipping lines are likely to take corrective and mitigative actions – either scaling
down services, seeing alternative ports and/or imposing congestion surcharges - Tying up this much capacity will have a negative impact of overall fleet utilization and efficiency meaning a tighter tonnage balance, further
pressure on rates (at least short term) and likely lead to decline in scheduling integrity and service consistency - The increased waiting time will also impact negatively the vessel’s CII rating further compounding the negative aspects
All data in this report is derived from the Esgian Shipping Suite for RoRo providing deep insight and value to truly understand the dynamics of the global RoRo industry.